The expansion verdict, in minutes.
GrowSmart turns a six-week, six-figure site feasibility study into a board-ready Go / No-Go verdict — on up to 208 cities. Frontier AI, grounded in live market data, with every claim sourced and dated.
The pilot is paid — 1 site or city, 5 business days — and the fee is credited against your plan if you proceed.
Same engine — calibrated to day-delegate rates, capacity bands and corporate-event demand. Live now across 208 cities.
Unmatched corporate HQ density
Revenue compressed into Tue–Thu
Elizabeth Line unlocks new micro-markets
Extortionate lease costs
Every new site is a multi-million-pound bet — gated on one question.
Is the demand real, at the right quality, in this exact submarket? Today that answer takes six to twelve weeks and up to ~£250k per market — and it arrives inconsistent, market to market. Your capital waits on research bandwidth.
In-house research
Weeks per site, inconsistent across analysts, impossible to compare market to market.
CBRE / JLL reports
A generic office-market lens. No category-specific read, no verdict, no scoring.
Commissioned studies
Up to ~£250k per market, 6–12 weeks, one-shot. It never refreshes.
Generic AI chat
Prose, not a verdict. No rubric, no sources, nothing you’d take to a board.
Frontier AI can now do the analysis that took a team six weeks.
GrowSmart runs frontier AI at high reasoning effort, grounded in live web search, with quantitative code execution — and returns the structured, board-ready analysis a market-entry study used to require. One consistent verdict per city, in minutes.
Four explicit verdicts, with thresholds — the engine is told not to hide behind a safe “Conditional Go.”
Weeks to minutes.
The verdict that took a six-week study lands in minutes. Screen a whole expansion pipeline in the time one commissioned study used to take.
It names the real market.
Not generic AI filler — the actual operators, districts, rates and risks an insider recognises. The room stops debating the tool and starts debating the decision.
Honest about the downside.
A verdict that names the risks and the weak scores, not a pitch for “go.” You can trust a Strong Go because you’ve watched the engine say Hold and No Go.
From a city name to a board-ready verdict.
Pick a city
Up to 208, across 7 regions.
The AI analyses it live
Demand, competition, location, unit economics — grounded in current market data, calibrated for your category.
Get a clear verdict
Strong Go / Conditional Go / Hold / No Go — sourced, dated, board-ready.
Screen the pipeline
Compare your shortlist on identical criteria; export the board pack in one click.
Same engine. Your category’s metrics.
The framework never changes — demand, competition, location, financials, then a verdict. What changes per industry is the demand signal inside each dimension. Venues, hotels and restaurants run live across 208 cities. Retail — and any category you name — we calibrate to your metrics and prove on a paid pilot before you commit.
Venues & flex
What we measure
Day-delegate rate · five delegate-capacity bands · corporate-event market size
Restaurants & F&B
What we measure
Catchment footfall · daypart demand · average check · cuisine saturation
Hotels & resorts
What we measure
ADR / RevPAR · room-night demand · brand-tier gap · seasonality
Retail & flagship
What we measure
Catchment spend · trade-area density · footfall · co-tenancy mix
Don’t see your category? The engine is category-agnostic — tell us what decides demand and we’ll calibrate it.
One analysis. Everything a committee needs.
Overview — Economic tier, GDP (USD-normalised), category market size, key industries, major employers.
Market Demand — A 0–100 score with rationale, a demand ceiling, and capacity-vs-supply across category-specific bands.
Competition — Mapped competitors, gaps, suggested districts, and a 0–100 opportunity score.
Location — Five sub-scores on a radar: transport, prestige, hotel adjacency, growth, walkability.
Recommendation — The verdict, positioning, target segments, risks, next steps, full SWOT, confidence.
Financials & Sources — Capex, breakeven, payback; clickable citations, a confidence badge, a “Data as of” date.
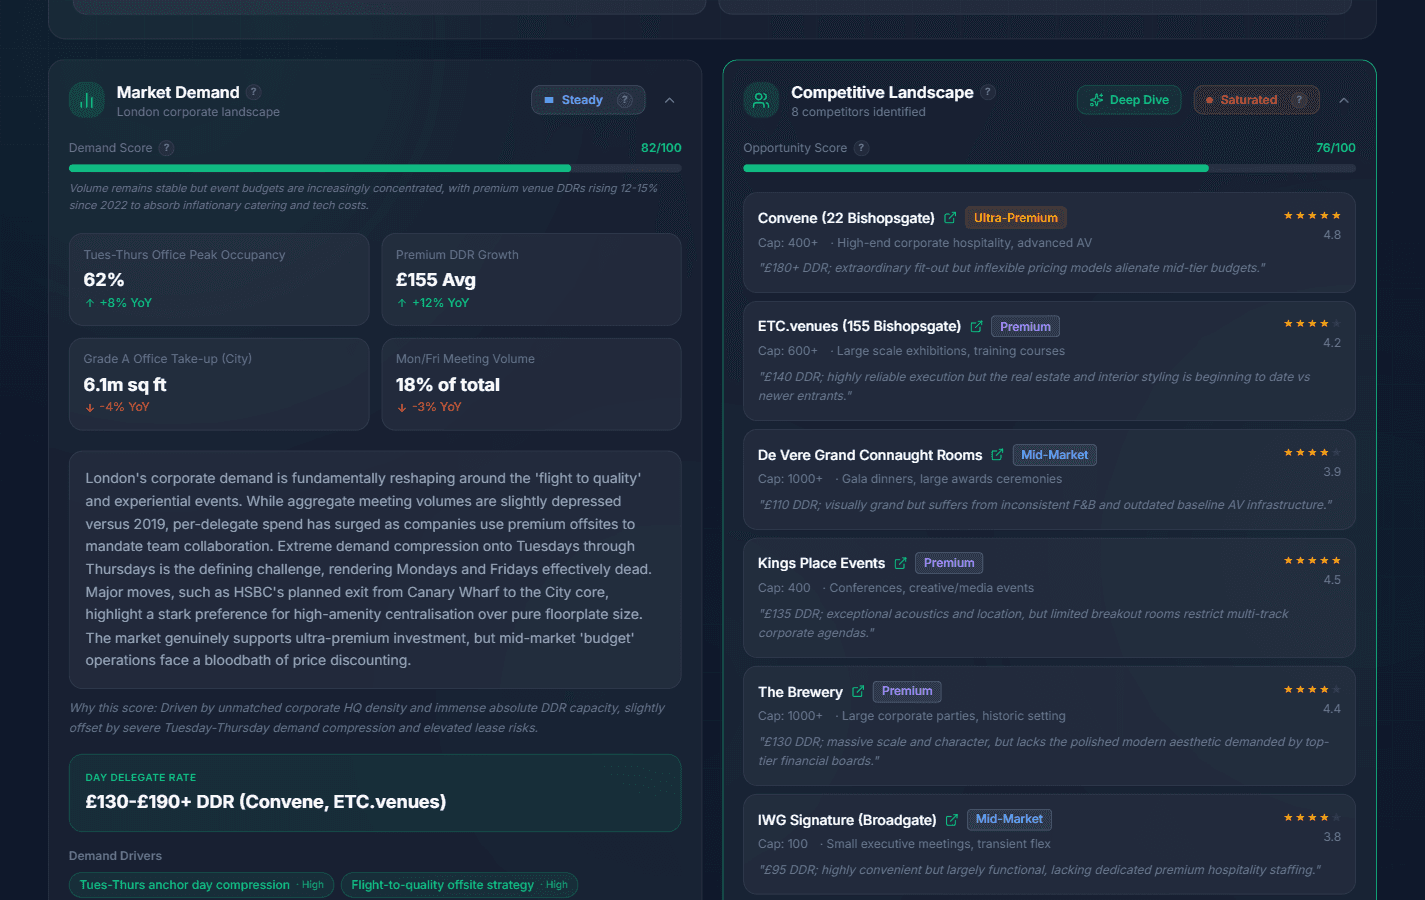
Shown: the venues report — the same six-part structure is calibrated per category.
The whole pipeline, scored and ranked.
Every market on one comparable framework — demand, opportunity and an explicit verdict. Screen the pipeline at a glance, then drill into the ones that move.
across 7 global regions
clear quality chasm, demand ≥ 75
portfolio-wide, 0–100
under-served premium segments
City Intelligence Index
Every market on one comparable framework.
Illustrative data — city names are public markets; scores, verdicts and trends are for demonstration only and don't reflect a live GrowSmart analysis.
Go deeper — without going soft.
Extend the verdict with on-demand research on the three questions that actually move a committee — and every dive shows its own working, including the parts it isn’t sure of.
Risks
The structural and execution risks of entering this market — saturation, lease exposure, demand durability — named, not hand-waved.
Target Segments
Which corporate buyer segments to pursue first, sized by local demand depth and ranked by how winnable they are.
Next Steps
The concrete sequence of moves — site search, anchor-tenant conversations, the order that de-risks the spend.
The dominant risk is not demand but the quality chasm closing faster than a new entrant can occupy it. The top tier behaves as a near-duopoly; a third premium operator must win on a differentiated micro-district and rate position, or accept a longer ramp to stabilised occupancy. Lease exposure is the second-order risk — headline rents in the prime core leave little margin if the breakeven occupancy drifts above ~65%. The structural demand is real and durable; the execution risk sits in timing the entry and pricing the room, not in whether the market exists.
- The £125 day-delegate ceiling assumes a 2027 rate environment; current contracts cluster lower.
- Anchor-demand depth is inferred from headcount growth, not signed group-booking data.
Illustrative — live dives source and date every figure. The model surfaces what’s soft instead of burying it.
Fewer verified claims beat more invented ones — the discipline is built into the prompt.
Run live, it names the right operators — unprompted.
We didn’t feed it these names. Three real cities, three honest verdicts — the operators it benchmarked against, unprompted.
London
Strong GoNamed Convene at “22 Bishopsgate and Sancroft” and called the top tier a Convene-led duopoly with a “quality chasm.” The LLM Council tempers it to Conditional Go (4/6) — more cautious about the saturation.
Manchester
Strong GoNamed etc.venues as the dedicated mid-market operator; pinned a realistic £115–125 DDR ceiling in the right micro-districts — Spinningfields and St Johns.
Miami
Conditional GoThe highest opportunity of the three — and the engine still withheld the Strong Go. Spotted the “Wall Street South” migration of Citadel, Elliott and Thoma Bravo, then flagged transport at just 60 against hurricane and lease risk.
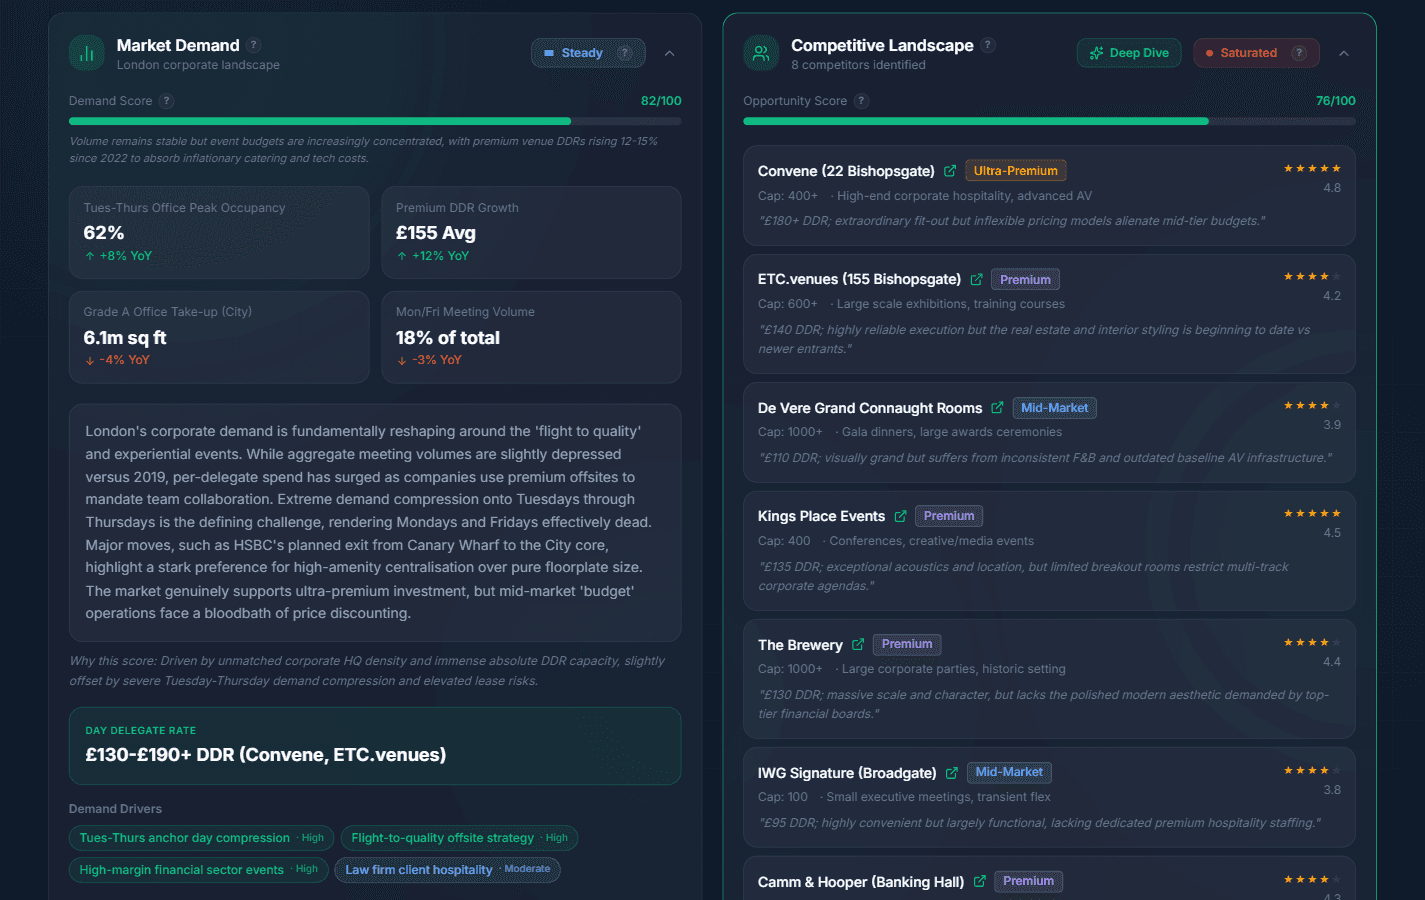
Specific, current, honest about downside — an insider recognises it as real. · Live verdicts refresh; figures reflect a June 2026 read.
Screen all 208 cities at once. Then put your shortlist side by side.
The City Intelligence Index ranks every city on demand, opportunity and verdict — with anomaly badges flagging the markets that don’t behave as expected. Screen the whole pipeline in one view, then line up your finalists on identical criteria in Comparison mode.
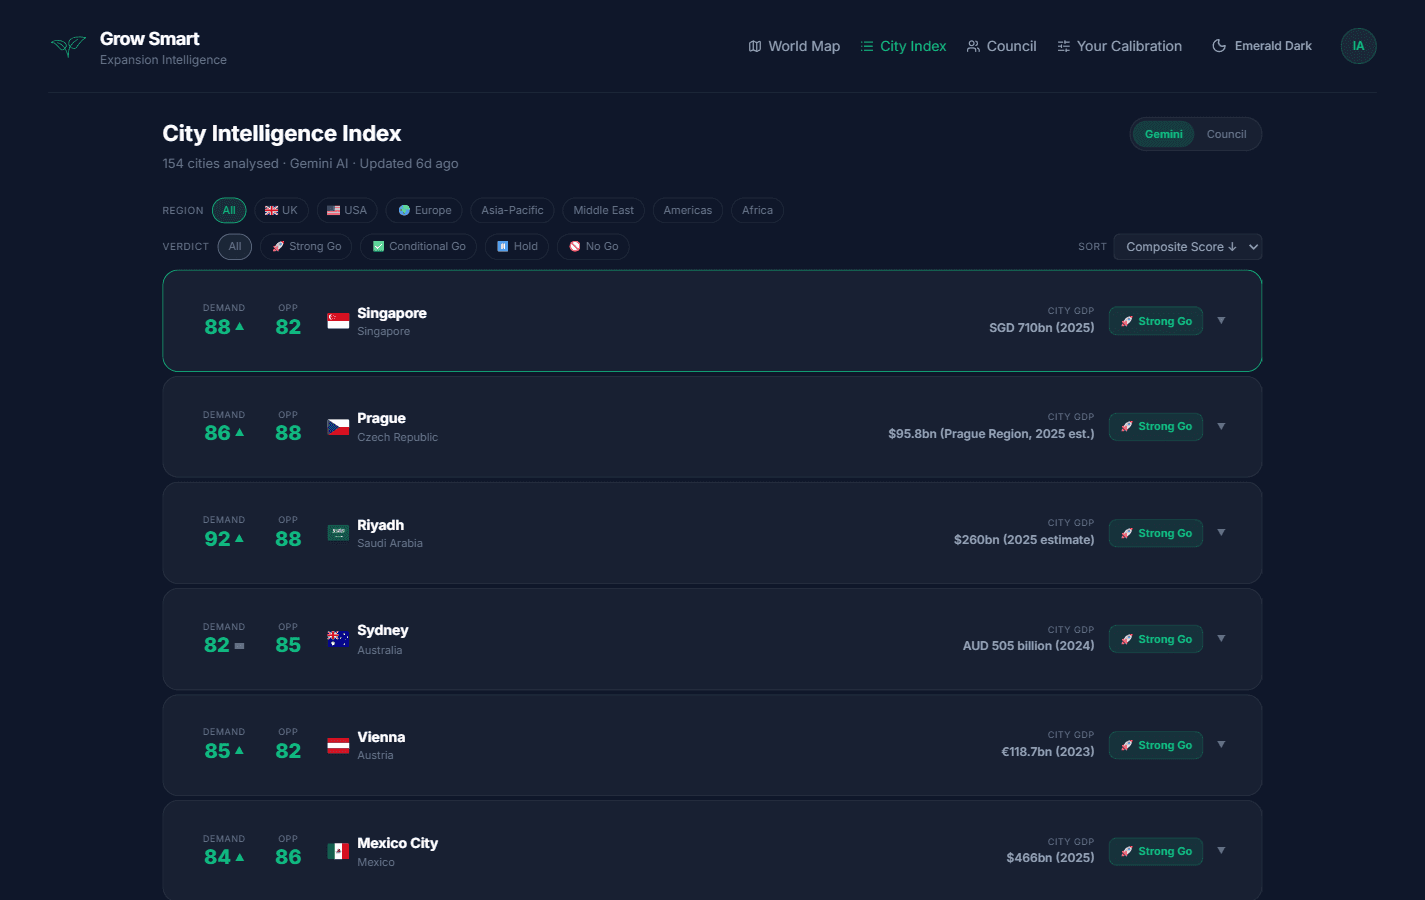
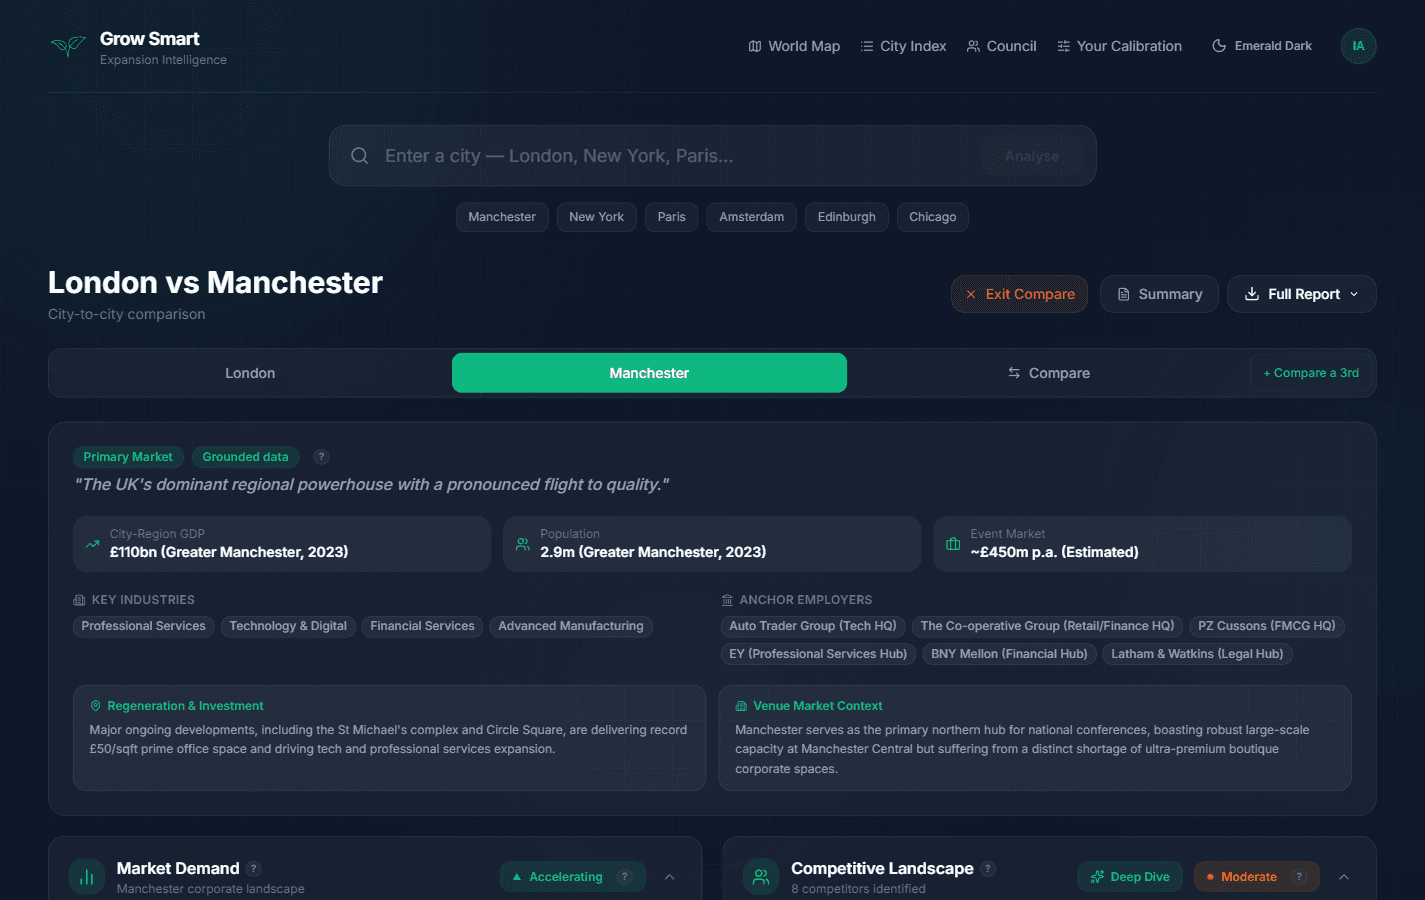
208 cities. 7 regions. One framework.
Every premium-venue market that matters, scored on identical criteria — from London and New York to Singapore, Dubai and São Paulo. One map, one comparable verdict per city.
- Europe66
- Asia-Pacific43
- USA34
- Americas23
- UK15
- Middle East15
- Africa12
- Total208
Want more cities — or a deep focus on one region or one country? The 208 are the starting set. Adding markets, or narrowing the lens to a single region or country, is a configuration — not a rebuild.
One scoring framework across every market · Hover any city to see its region
One study buys one city. The same money buys all 208.
For roughly the price of a single commissioned study, Pipeline gives your whole team all 208 cities — unlimited, and refreshed — instead of one city, once.
One framework, every kind of expansion decision.
Venues & flex
Find the quality chasm before a competitor does — and lock your competitive set.
Restaurants & F&B
Rank every catchment on real footfall and daypart demand vs. local saturation.
Hotels & resorts
Score each market on durable room-night demand and the brand-tier gap.
Retail & flagship
Underwrite the next flagship on catchment spend, trade-area density and co-tenancy.
Plus the PE, REITs and investors who back them — a same-day, comparable demand-durability verdict, straight into the IC memo, whichever category they’re underwriting.
Land on SaaS. Expand to bespoke + exclusive.
Pipeline
all 208 cities, unlimited
A real-estate / M&E team, a developer.
- Up to 8 seats
- All 208 cities, unlimited
- Pipeline dashboard & comparison
- Deep Dives + LLM Council
- Board-ready PDF export
Enterprise
bespoke + exclusive
An operator who wants it built around them.
- Scoring calibrated to your thresholds
- Private data environment
- Your branding throughout
- Sector exclusivity (3-yr min)
Exclusivity exists only at Enterprise, one operator per competitive set
The things buyers ask first.
Venues, hotels and restaurants are live today — across 208 cities — with real, sourced verdicts calibrated to each category’s metrics. Retail runs on the same engine and is in scoping — we stand it up with you on a paid 1 site/city pilot, so you see real output before you commit.
The framework is constant — demand, competition, location, financials, then a verdict. The signals inside each dimension are calibrated per category: day-delegate rates and delegate bands for venues, ADR / RevPAR and room-night demand for hotels, catchment footfall and average check for restaurants, catchment spend and trade-area density for retail.
No — the LLM Council fans a city out to a panel of frontier models and synthesises a consensus, so you see agreement and divergence, not one opaque view. Every analysis is also schema-validated and grounded in live web data.
Live web grounding, named clickable sources, a Grounded / Mixed / Estimated badge on every analysis, and Deep Dives that flag their own unverified claims. The engine is instructed to red-team — it will say Hold and No Go.
Speed (minutes vs 6–12 weeks), cost (~£45–£100k a year for the full city index vs up to ~£250k for a single-city study), consistency (one framework across every city), and independence — you own the analysis, with no commission-paid agency in the loop.
Live web-grounded at run time, with a “Data as of” date and a confidence badge on every analysis. It reads the current market, not a training-data snapshot.
Exclusivity exists only at Enterprise and binds only within your competitive set — one operator per set. Different buyer types draw different boundaries, so each can hold it without conflict.
A paid pilot — 1 site or city of your choosing, to your criteria, in 5 business days — with the fee credited against an annual plan if you proceed.
Prove it on one site or city of your choosing.
Book a demo and we’ll run GrowSmart live on the markets you’re weighing now — and let it name your real competitors. Or start a paid pilot: 1 site or city, your category’s criteria, 5 business days, the fee credited against an annual plan if you proceed.